Know the company.
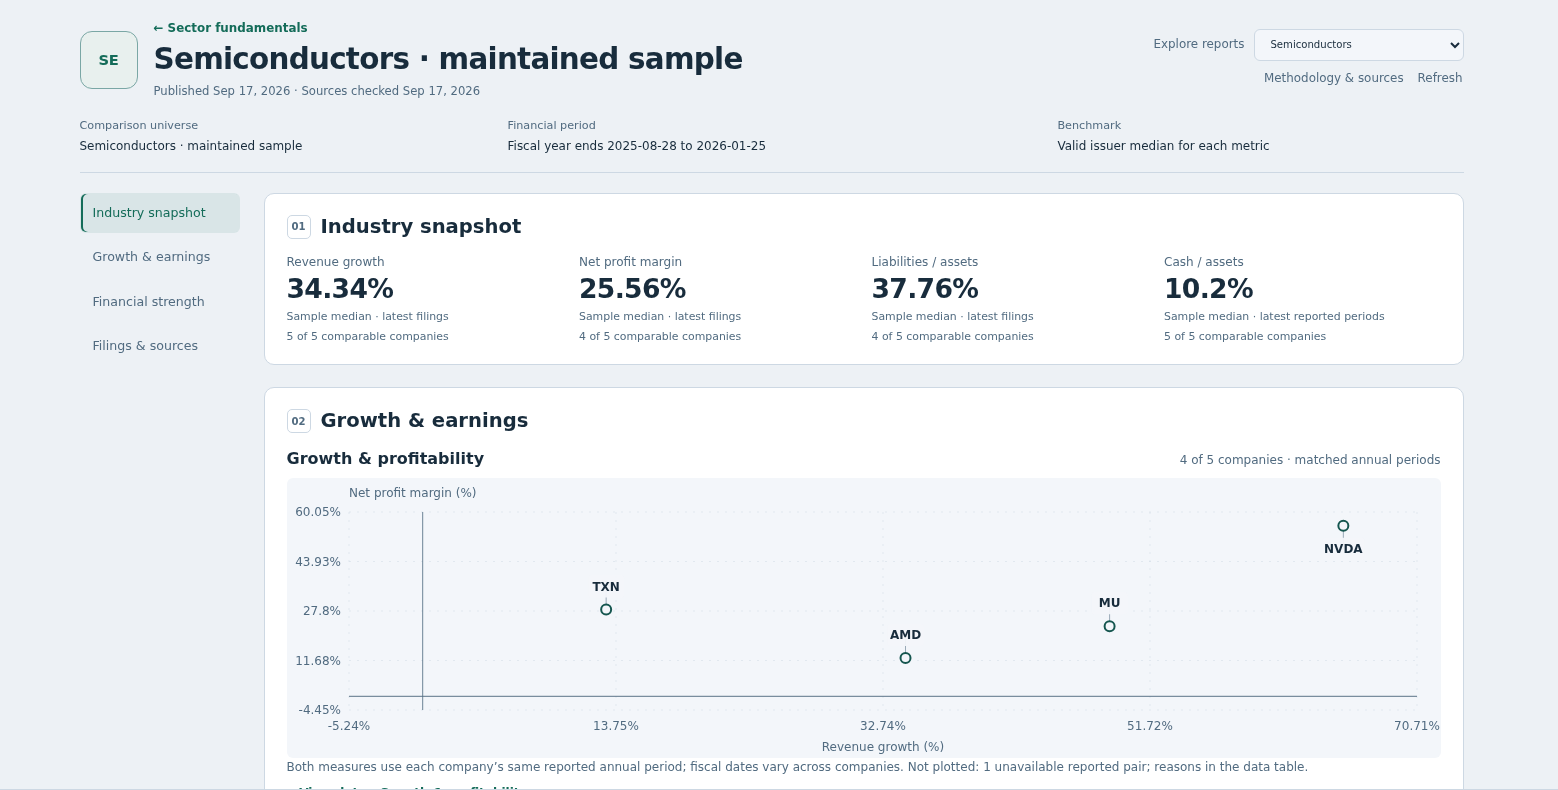
Compare reported growth, margins and balance-sheet measures. Online adds industry discovery and income/cash conversion bridges, with exact values and source filings.
Company research ↗ROCK RIVER RESEARCH / MAKERS OF ROCKSOLID TRADER™
Meet RockSolid Trader. Visual scripting, company and energy intelligence, stock backtesting, options strategies, alerts and portfolio analysis. Online and native Windows Desktop, together in one subscription.
30-day free trial, then $24.99/month for Online + Windows Desktop. Or $249/year paid upfront. Pricing details ↗
01 / ROCKSOLID INTELLIGENCE PORTAL
Explore the business, the economy and the evidence behind an idea. Intelligence brings that research beside your trading tools in both apps.
Compare reported growth, margins and balance-sheet measures. Online adds industry discovery and income/cash conversion bridges, with exact values and source filings.
Company research ↗Follow inflation, jobs, housing and Treasury yields. Online’s Energy workspace adds fuel prices, oil and refining, natural-gas storage, electricity and household energy inflation from official sources.
Watch economic research ↗Consult official release calendars, financial reporting periods and original filings. Keep sources and observation dates within reach.
Explore Intelligence Portal ↗02 / OPTIONS LAB · ONLINE + DESKTOP
Build the structure before you place the order. Start with a template or custom legs, then see how the payoff responds to your assumptions.
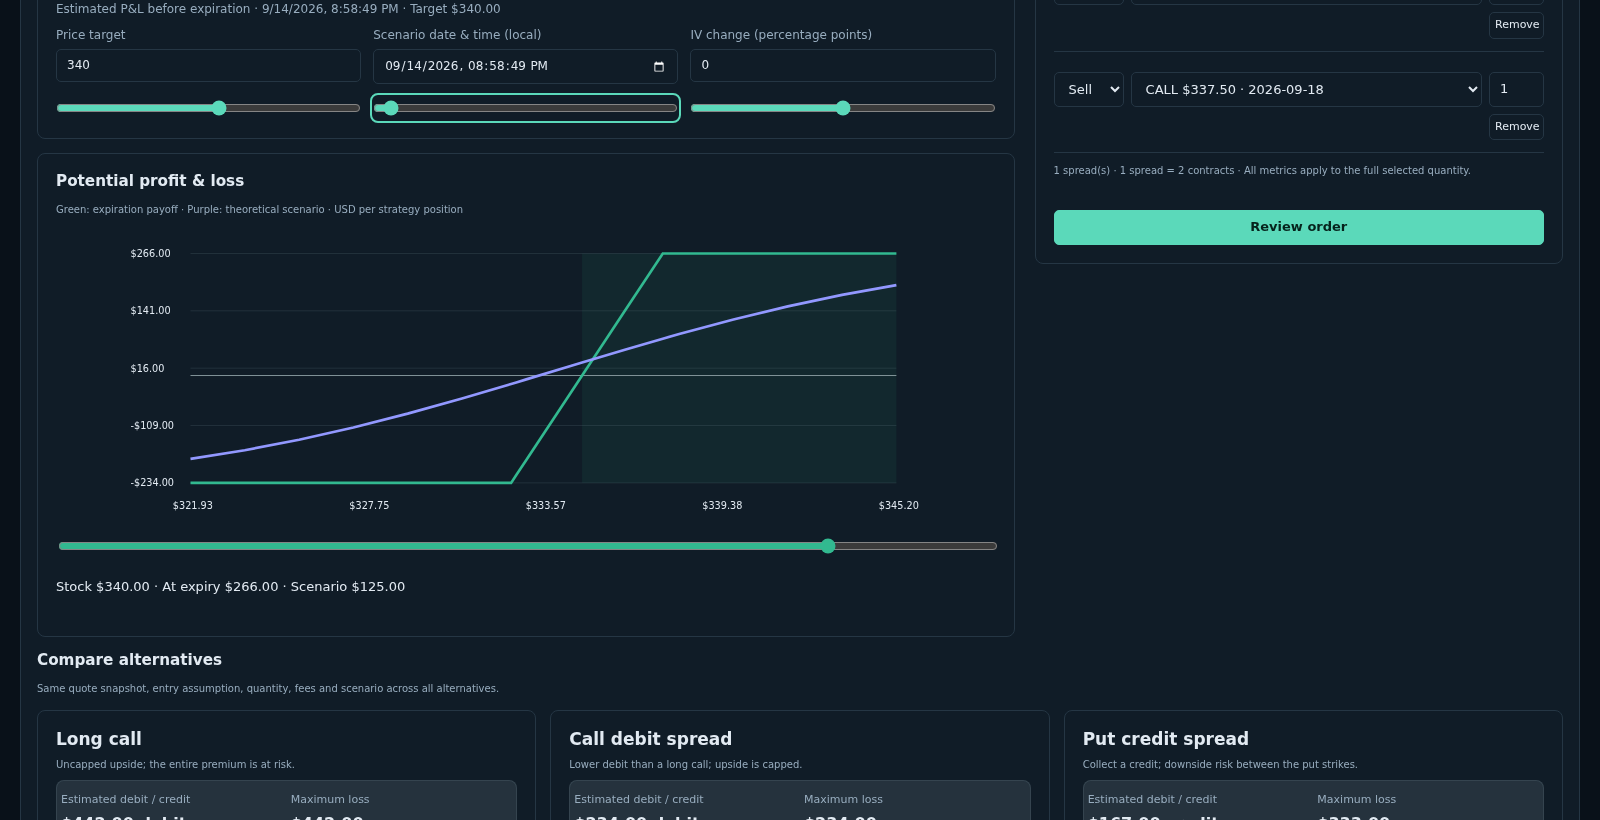
Scenario values are theoretical estimates under the displayed assumptions. Broker permissions and order checks apply.
03 / TOTAL PRO · INCLUDED WITH ONLINE
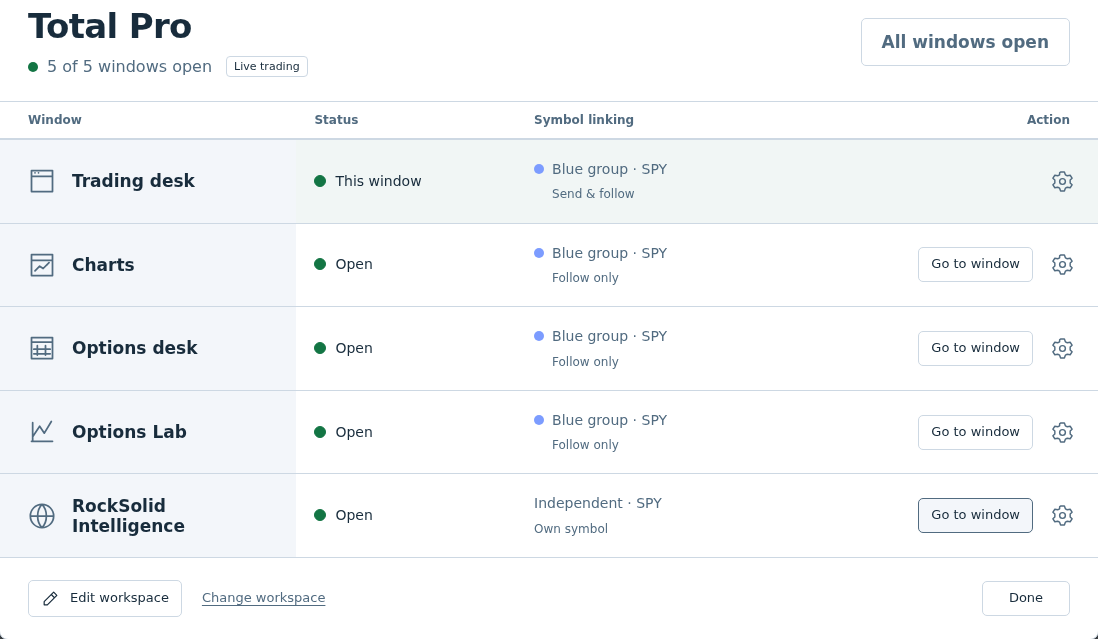
Build a 13-chart Online setup and keep Options Desk, Options Lab and Intelligence open alongside it. Three Charts windows plus Trading Desk give you the charts; all seven windows fit within the eight-window workspace. Total Pro is included, with no separate chart-window upgrade.
Main chart, watchlist, account and order tools.
Four companion charts, each with its own symbol and timeframe.
Calls, puts, Greeks and liquidity beside the underlying.
Strategy construction, payoffs and what-if analysis.
Company comparisons, economic research and market context.
04 / NATIVE WINDOWS DESKTOP · SAME SUBSCRIPTION
Bring native volume analysis, scanning and reporting into your routine. Desktop adds its own tools and workspace, alongside your Online access.
WINDOWS DESKTOP / VOLUME ANALYSIS
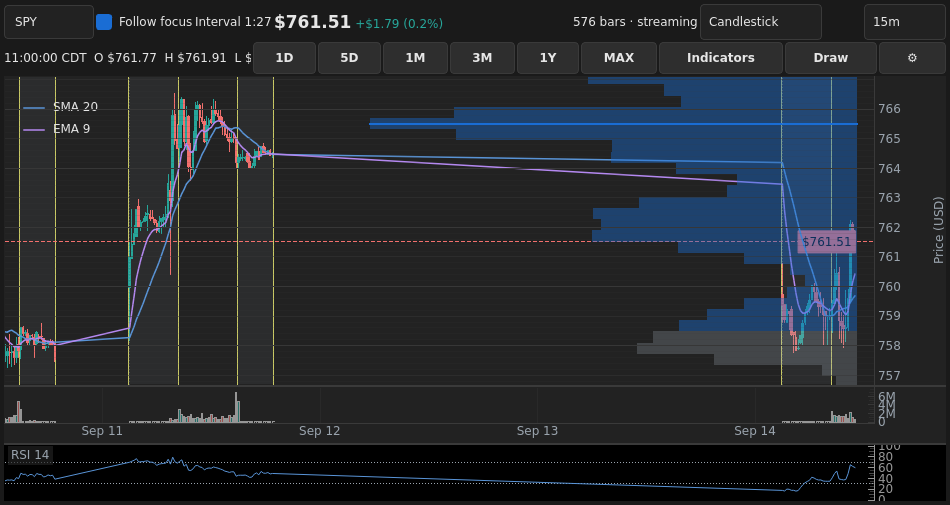
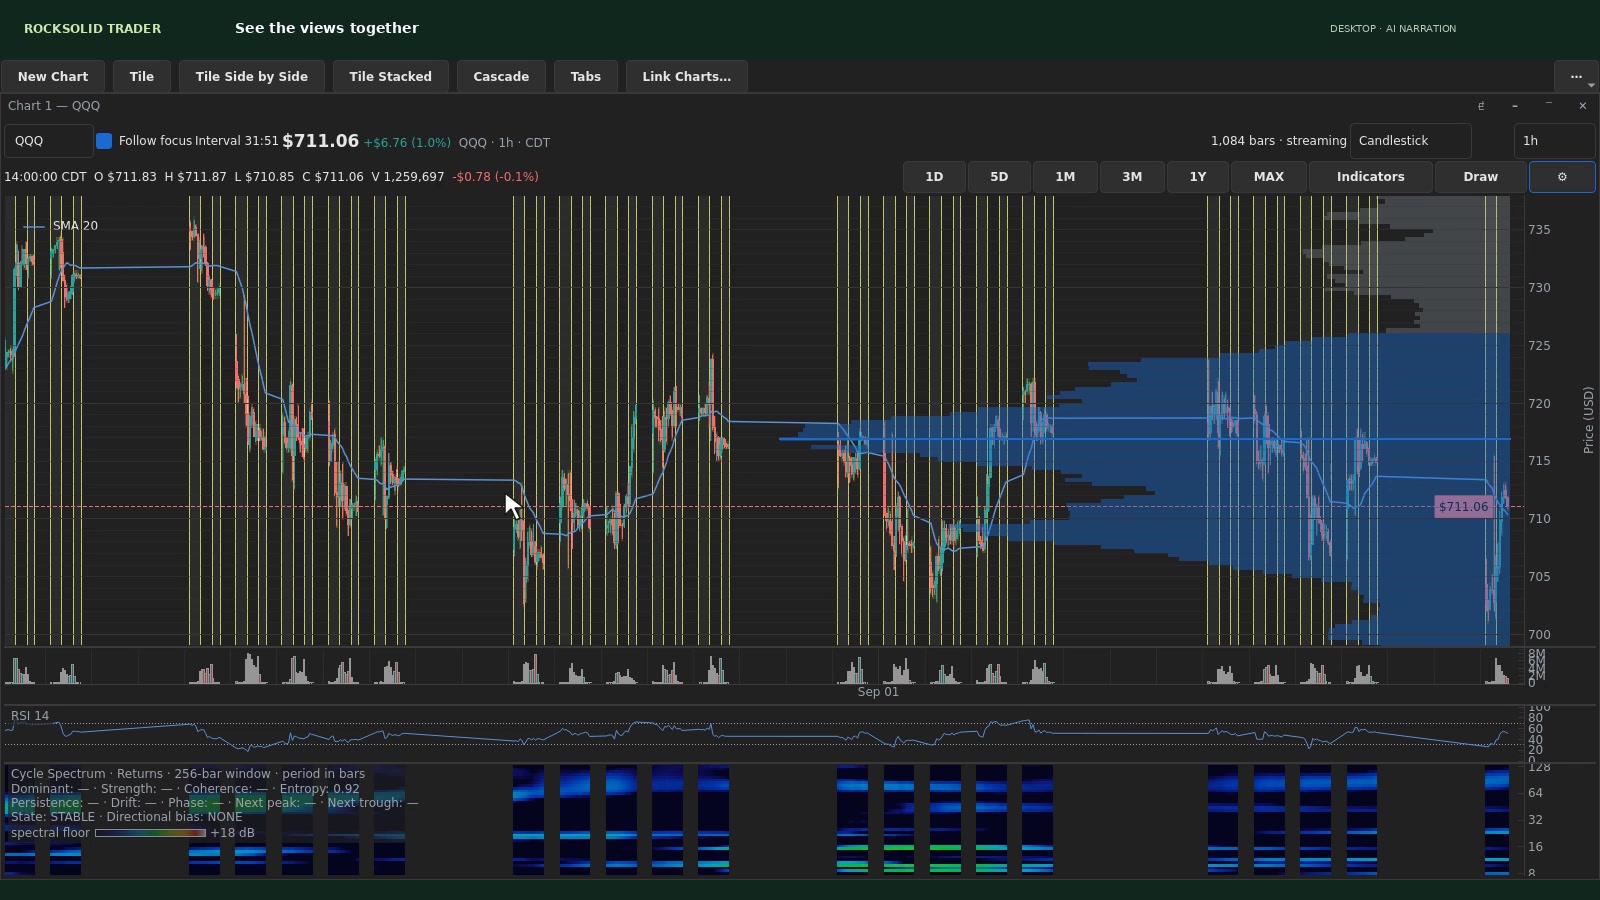
Read volume at price alongside the chart. Explore Volume Profile, footprints, volume heat and Cycle Spectrum for a closer look at the move.
Explore native volume tools ↗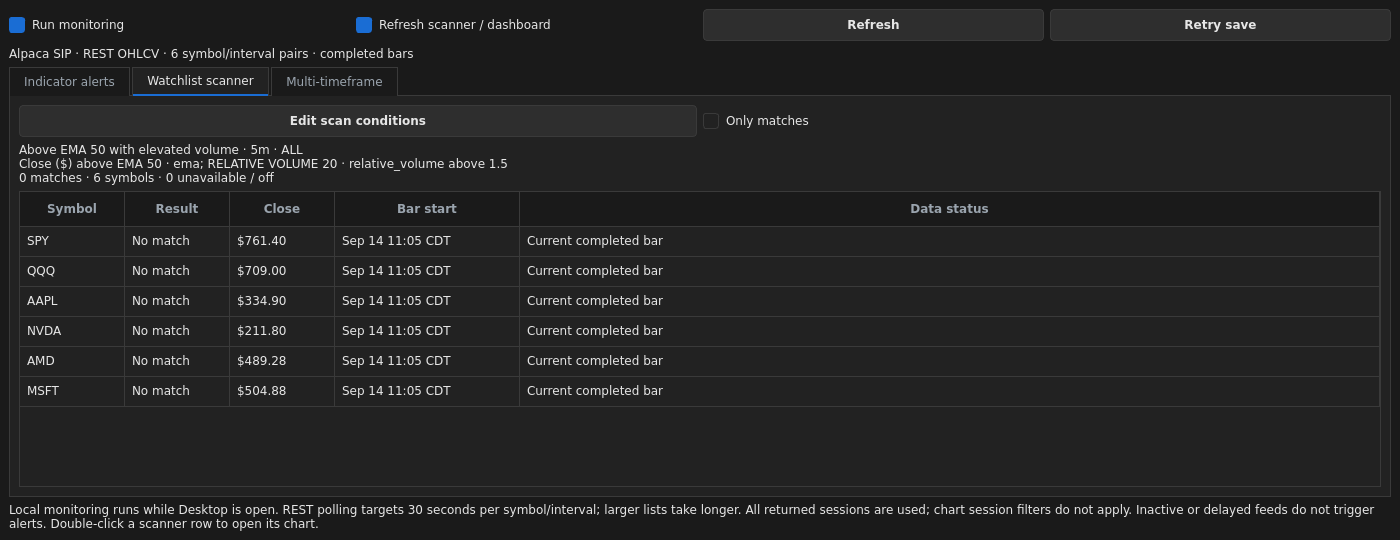
WINDOWS DESKTOP / SCANNER & ALERTS
Scan your watchlist, compare five timeframes and monitor up to 100 local alert rules, with up to eight conditions in a rule.
Explore scanning & technical analysis ↗Room to work. A record to keep. Open up to eight native charts across four canvases. Review session, account, order-audit and data-integrity reports, with export options.
Meet Windows Desktop ↗SCRIPT STUDIO / ONLINE + WINDOWS DESKTOP
Build an indicator, scan your watchlist, create an alert or define a stock strategy. Snap together visual blocks, edit the script, or work in Split view. One definition carries the logic from analysis to a historical test.
Explore Script Studio ↗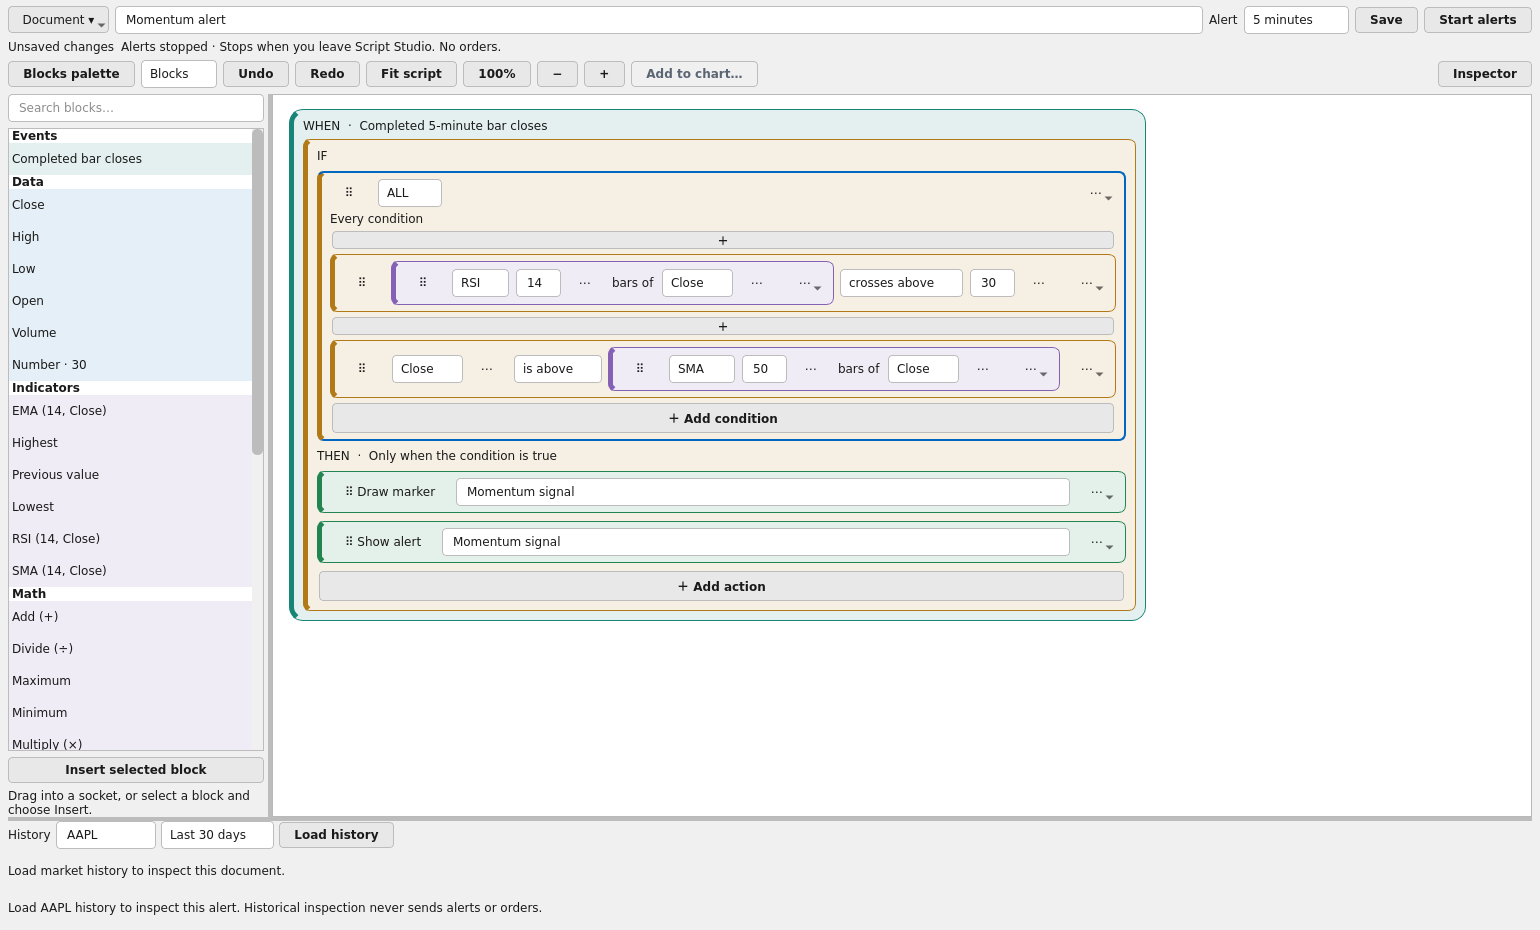
START WITH AN IDEA, NOT A BLANK PAGE
Online includes 40 editable examples: 12 indicators, 12 scanners, eight alerts and eight stock backtests. Explore trends, momentum, breakouts, volume and price action, then save your own version.
Shown: the actual native Desktop editor. The 40-example catalog is an Online feature. Script Studio does not submit unattended broker orders.
Build your first tool ↗STOCK BACKTESTING / INCLUDED IN ONLINE + WINDOWS DESKTOP
A setup is an idea. A backtest lets you examine it. Build stock-trading rules, run a historical simulation and see the returns, drawdowns and individual trades behind the result—all in your shared subscription.
Start with a moving-average crossover, RSI pullback or MACD crossover. Set entry and exit rules, choose stocks and history, and define your starting capital and position sizing.
Include spread, slippage and commission assumptions. Compare the equity curve with buy-and-hold, inspect drawdown and follow the simulated trades that produced the result.
Reserve a later period for holdout testing. Compare nearby parameter choices, keep strategy versions and export results for a closer review.
20 shared cloud runs per UTC calendar month across Online and Desktop, subject to processing allowance. Long-only US common stocks · Daily or 15-minute history · Hypothetical results, not a forecast or live orders.
Explore stock backtesting ↗ONLINE / FROM A SIGNAL TO THE ACCOUNT RESULT
Keep your research, monitoring and portfolio review in the same workspace. The expanded Online tools are included alongside native Windows Desktop.
Watch completed-bar setups, selected watchlists, order status, account risk and published research. Keep priority, acknowledgment, snooze and the source evidence together in a session-based alert desk.
Explore alerts ↗Compare funding-aware daily returns with ETF price benchmarks. Review contribution, sector and industry exposure, concentration and explicit dollar scenarios before opening a holding for closer review.
Explore portfolio analysis ↗Move Watchlist, Charts and Order ticket panels into docked positions. Drag symbols into your preferred order, save personal layouts and open linked chart, options and research windows.
Explore Total Pro ↗05 / SEE THE APPS AT WORK
Real app walkthroughs, narrated steps and optional captions. Online and Windows Desktop have separate tutorial libraries, so you can follow the app you use.
 ▶ Watch · 1:00
ONLINE / NARRATED WALKTHROUGH
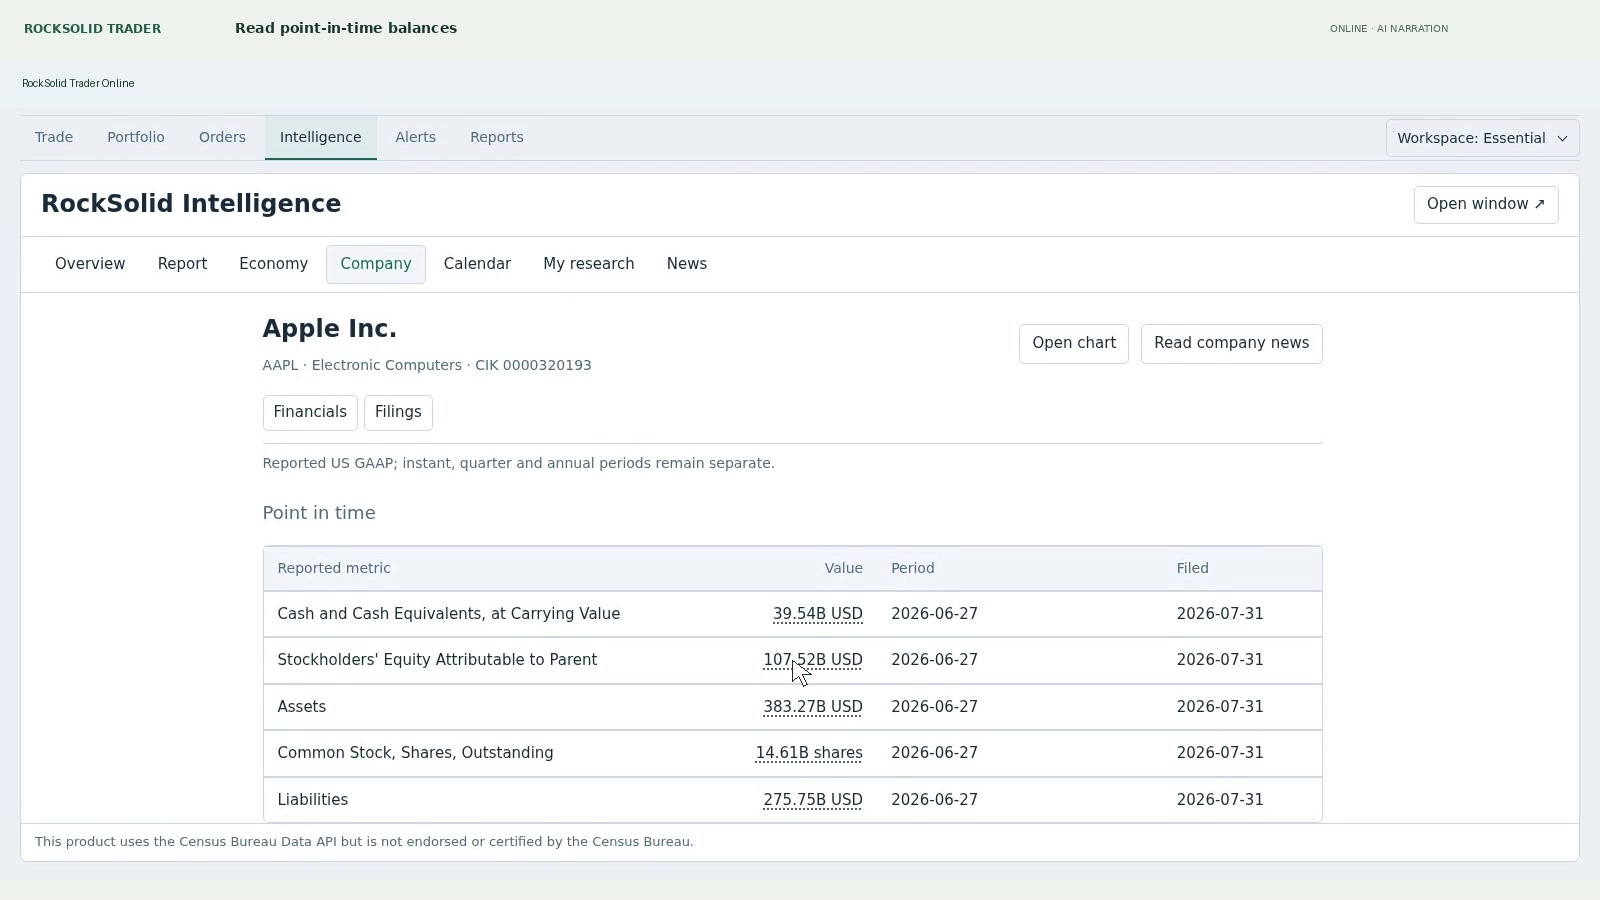
Read point-in-time, quarterly and annual figures, inspect older source facts, and find the original SEC filing.
 ▶ Watch · 0:40
WINDOWS DESKTOP / NARRATED WALKTHROUGH
Add volume tools and change the chart presentation in Windows Desktop.
ONE SUBSCRIPTION / THE WHOLE WORKFLOW
Script Studio, Intelligence Portal, Total Pro, stock backtesting, Options Lab, alerts and native Desktop tools are included. Use your own eligible brokerage account for market data and trading.
Compare features and costs across eight platforms ↗30-DAY FREE TRIAL
$24.99/month after trial
Or $249/year paid upfront.
Explore the subscription ↗Monthly billing has no annual commitment. The annual plan is billed upfront and has no trial. Broker and market-data charges are separate. Existing customers retain their promised terms.
Online and Windows Desktop: Preparing for release.
THE COMPANY BEHIND THE WORKSPACE
Rock River Research builds focused tools and supports them directly. RockSolid Trader is our flagship trading platform. We also build RockWiFi, RockTerm and RockSolid Money.