ROCK RIVER RESEARCH / ROCKSOLID TRADER

Understand the market.
Work the whole trade.

Start with the broader market. Research a company. Build the chart and explore a strategy. RockSolid Intelligence Portal brings the research into a full trading workspace, with Online and native Windows Desktop in one subscription.

Explore RockSolid Trader ↗

30-day free trial, then $24.99/month for Online + Windows Desktop. Or $249/year paid upfront.

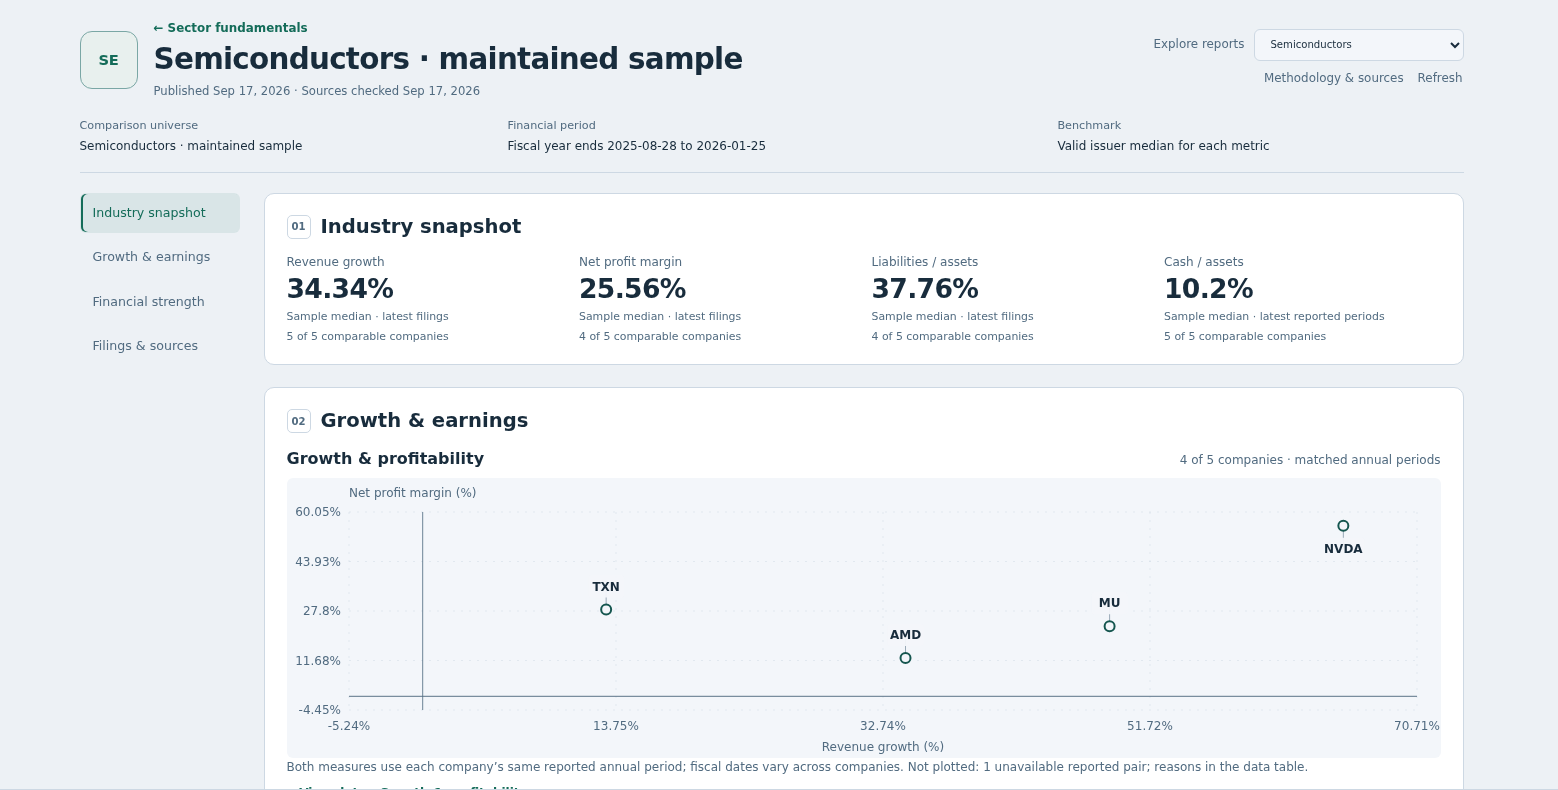
Online RockSolid Intelligence semiconductor report comparing reported revenue growth and net profit margins for covered companies
Online · Intelligence company comparison · Reported SEC financials · Daylight · September 17 captureView full size ↗
13charts in an example Online setup
93study types in both apps
32studies per Online chart
2apps in one subscription

ROCKSOLID INTELLIGENCE PORTAL / ONLINE + DESKTOP

The market. The economy.
The companies you follow.

Move from the market overview to the evidence behind an idea. Intelligence Portal brings benchmarks, economic indicators, company financials, official release dates and news into one research destination.

MARKET & ECONOMY

See the setting for the move.

Compare four benchmark ETFs and 11 sector ETFs, then explore inflation, jobs, rates, consumer spending and housing. Open an indicator’s history to compare the latest observation with earlier reporting periods.

COMPANY & FILINGS

Know the business behind the symbol.

Review reported quarterly and annual financials and balance-sheet facts, with periods, units and links to SEC filings. Move between the company, its chart and its news without losing your place in the trading workflow.

CALENDAR & MY RESEARCH

Keep your questions close.

Save the economic indicators you follow, open research for watchlist symbols and holdings, and consult BLS and Federal Reserve release schedules. Sources and reporting dates stay visible so you can check the evidence.

Included in your RockSolid subscription. Research observations retain their own reporting dates; streaming prices and brokerage services use your separate broker connection.

ONLINE / YOUR MULTI-WINDOW WORKSPACE

Give every part of the market its own view.

Give each symbol and timeframe room. Add Charts windows with four independent charts apiece: two Charts windows plus Trading Desk give you nine price charts; three give you thirteen. Keep Options Desk, Options Lab and RockSolid Intelligence alongside them in the same eight-window workspace. Total Pro and additional windows are included in your subscription.

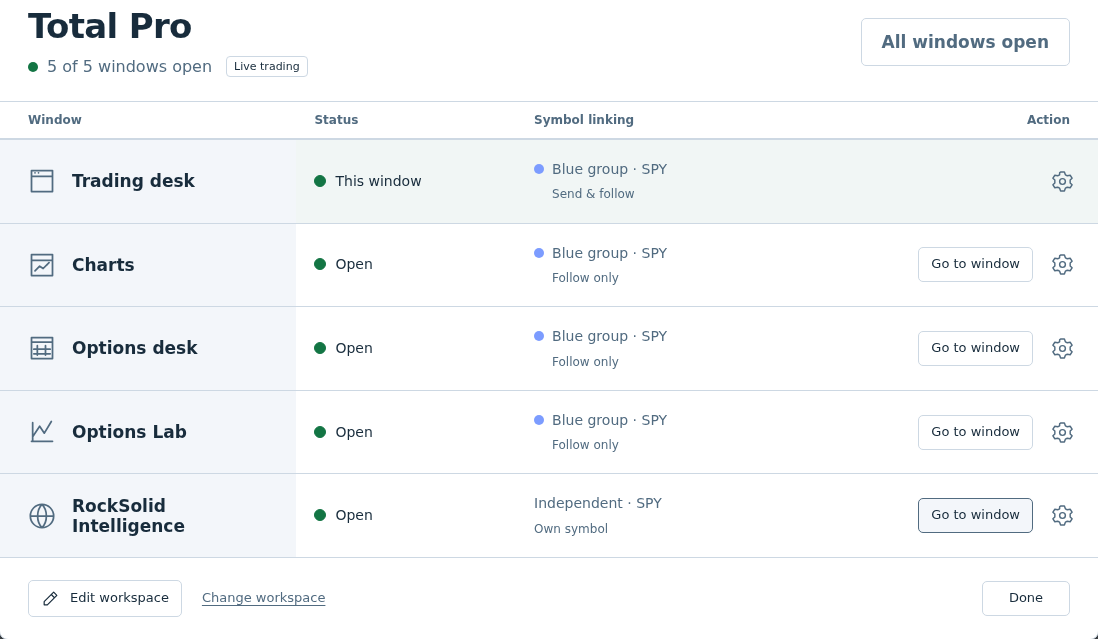
Keep Intelligence alongside your chart and order workspace. Link symbols across three groups, keep independent timeframes and arrange your workspace across monitors.

Explore workspaces and Total Pro ↗
Online Total Pro workspace manager in Daylight with Trading Desk, Charts, Options Desk, Options Lab and RockSolid Intelligence all open
Online · Five-window manager · Daylight · September 17 captureView full size ↗

CHARTS & ANALYSIS

Go beyond the price.

Build your view with studies, drawings and volume analysis. Scan your watchlist for setups, then open the chart to investigate.

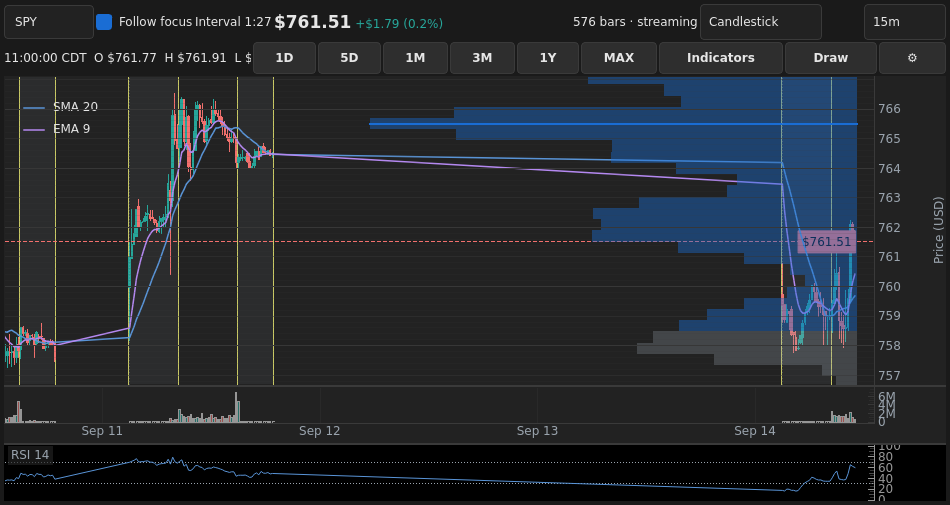
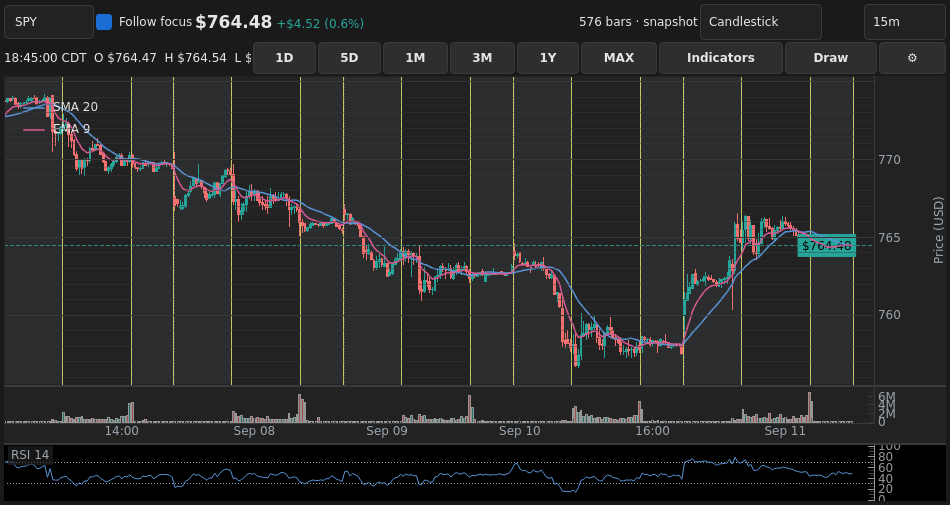
Desktop SPY volume profile showing real volume distributed across price levels beside the price chart
Desktop · SPY Volume Profile · broker-provided SIP · September 14 captureView full size ↗

See where trading concentrates.

Bring volume-at-price context into your native Desktop chart alongside the price action.

Explore volume tools ↗
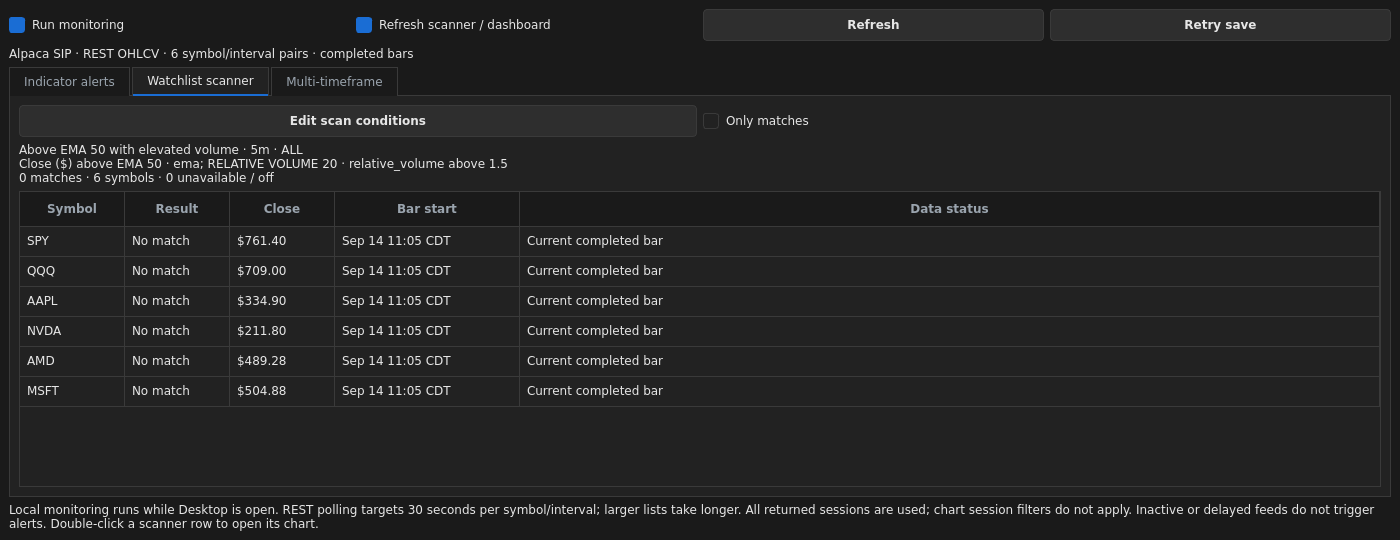
Desktop technical scanner evaluating six real watchlist symbols against EMA and relative volume conditions
Desktop · Watchlist scanner · Actual completed-bar results · September 14 captureView full size ↗

Find the next chart to study.

Use the Desktop technical scanner to review signals across your watchlist without opening every symbol first.

Explore scanning ↗

OPTIONS LAB / INCLUDED IN BOTH APPS

See the strategy.
Explore the possibilities.

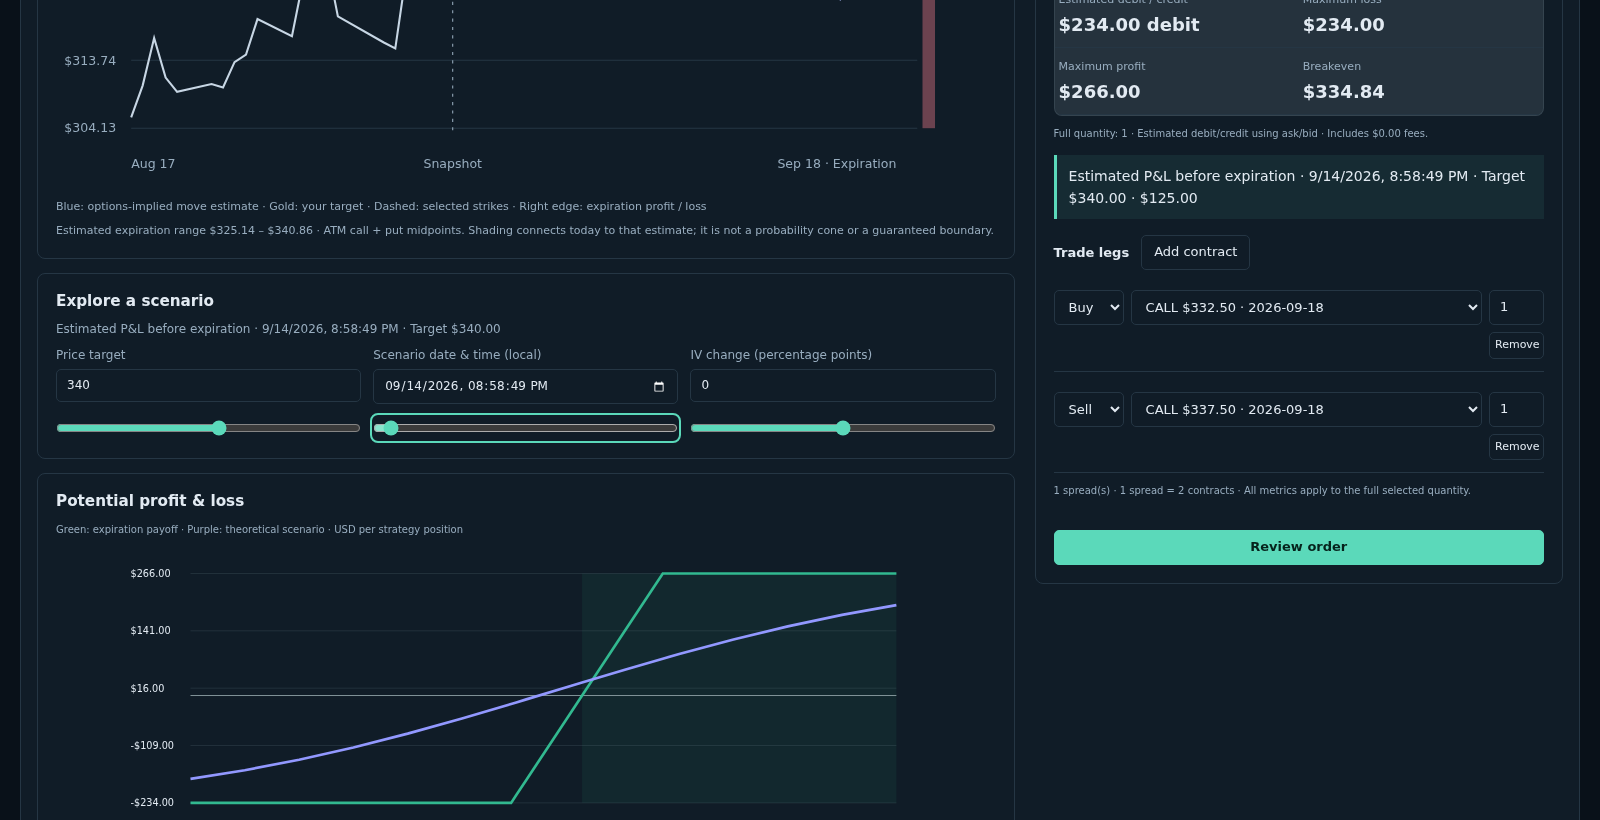
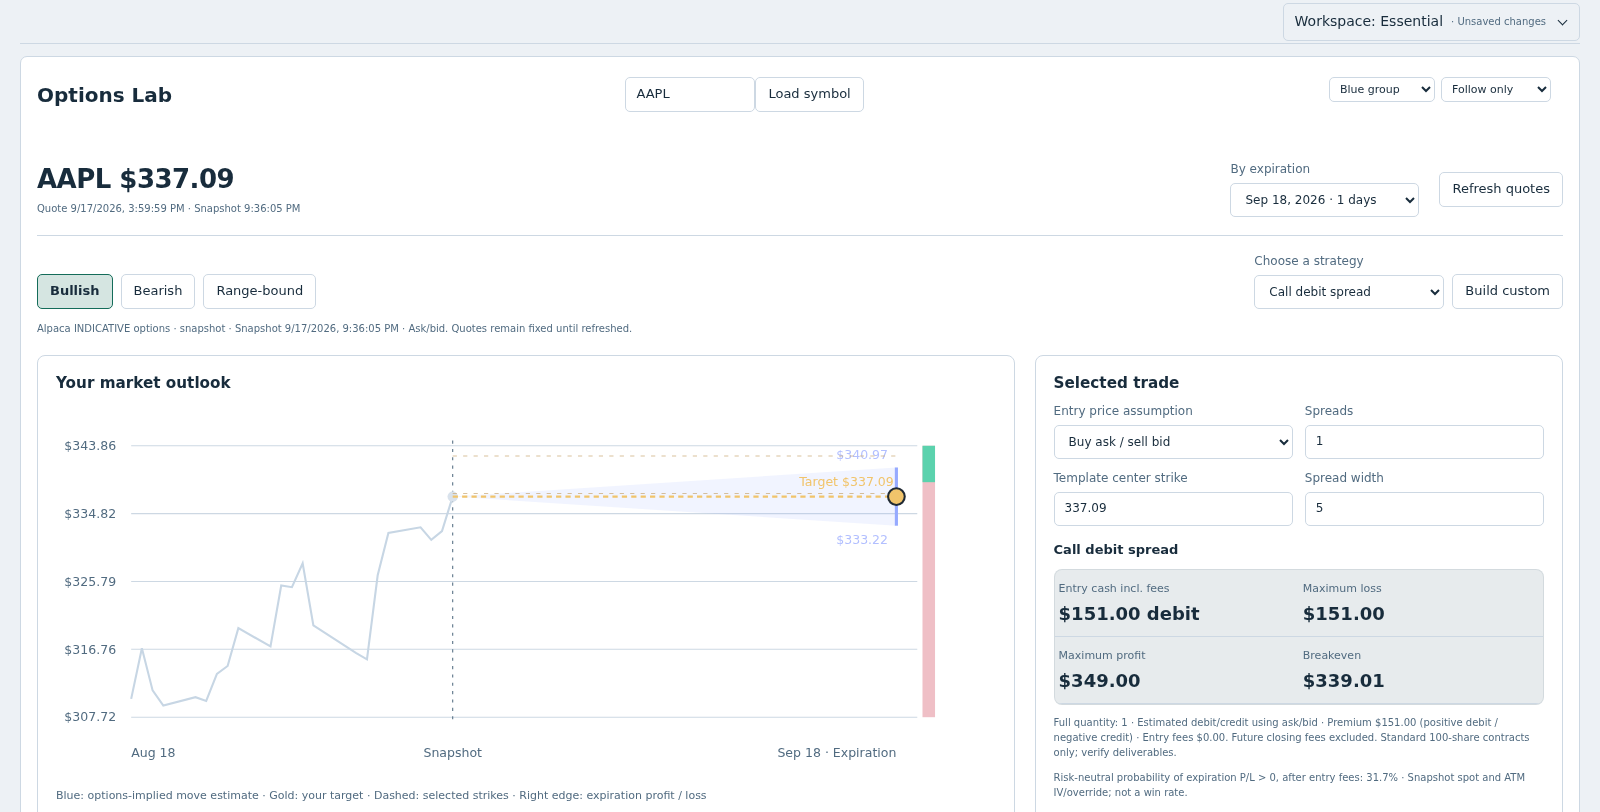
Start with a strategy template or build custom legs. Compare the debit or credit, maximum risk and reward, breakevens and Greeks.

Move the price, date and volatility assumptions to see how the modeled payoff changes before deciding what to do.

Explore Options Lab ↗

Scenario values are estimates under stated assumptions, not predictions.

Online Options Lab price, date and implied-volatility controls alongside the strategy legs and modeled payoff
Online · Price, date and volatility scenarios · Broker-provided indicative snapshot · September 14 captureView full size ↗

RESEARCH / CONTEXT WHERE YOU WORK

Follow the story.
Inspect the business.

Intelligence connects the broader research picture with the chart, news reader and company tools you use to investigate a trade. These existing Online and native Desktop views show that workflow.

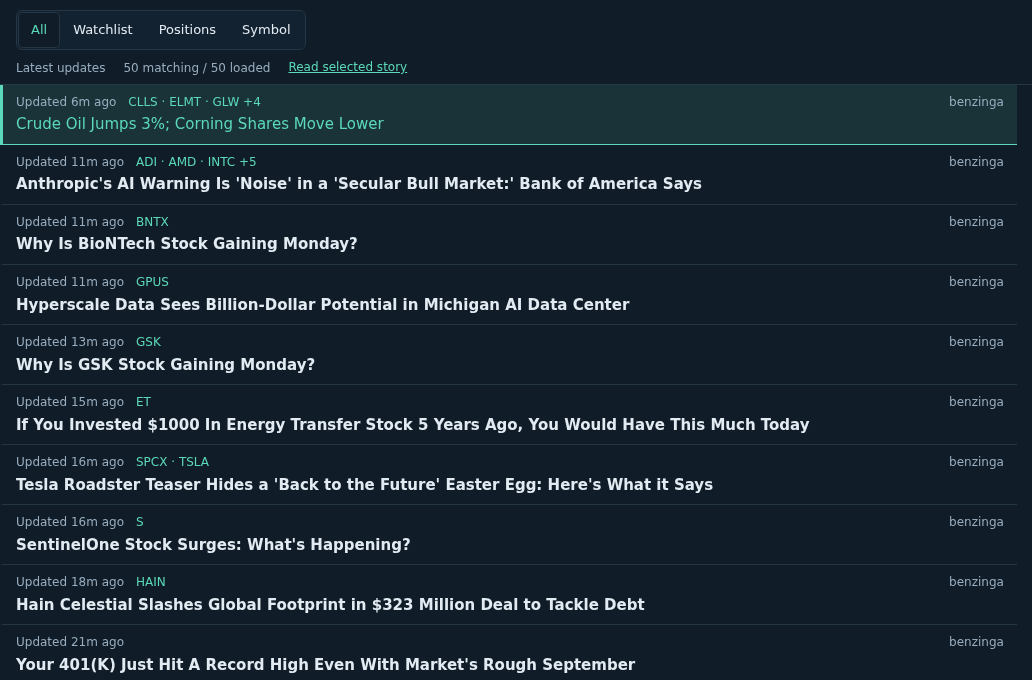
Online Research news scopes and real provider headlines received through your broker
Online · Research headlines and news scopes · Brokerage feed · September 14 captureView full size ↗

Follow the story in Online.

Read provider headlines for the market, your watchlist, your positions or one symbol. The news reader is part of Intelligence Portal, so you can move from the market backdrop into the story.

Explore market news ↗
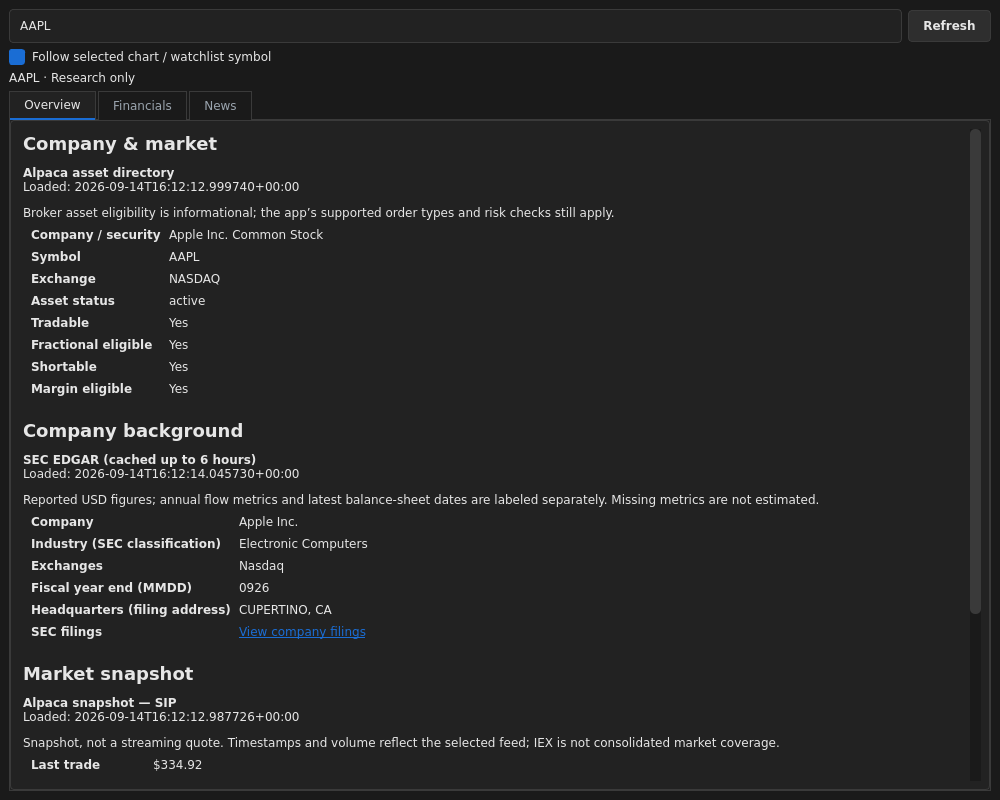
Desktop Company Profile showing Apple asset information, SEC company identity and a supported brokerage market snapshot
Desktop · Apple company overview · Broker-provided and SEC data · September 14 captureView full size ↗

Go deeper with Desktop Company Profile.

The native Company Profile shown here adds company information and reported financial context beside your charts. Intelligence Portal extends the research workflow with shared economic indicators, company facts and official calendars.

Explore company research ↗

MORE CHARTS. SAME SUBSCRIPTION.

Keep the setup.
Expand your view.

Follow the market, compare your watchlist and keep the trade in focus. Each additional Online Charts window adds four independent charts. Options and research keep their own space.

ONLINE / EXAMPLE LAYOUT

9 price charts

2 Charts windows × 4 + Trading Desk × 1

Keep one chart window on the broader market and another on your candidates, with the trade on your main chart.

With Options Desk, Options Lab & Intelligence: 6 windows total

NATIVE WINDOWS DESKTOP

8 price charts

Up to 4 canvases · 4 charts per canvas

Arrange up to eight charts in total across native canvases and monitors, alongside your Desktop analysis tools.

Included in the same subscription as your Online workspace

Online supports up to eight workspace windows. Nine and thirteen charts are example layouts, not maximums. Total Pro starts with five charts across Trading Desk and one Charts window; you can add more Charts windows without changing plans.

See how to add and save workspace windows ↗

WINDOWS DESKTOP / INCLUDED IN YOUR SUBSCRIPTION

A native desk with room to work.

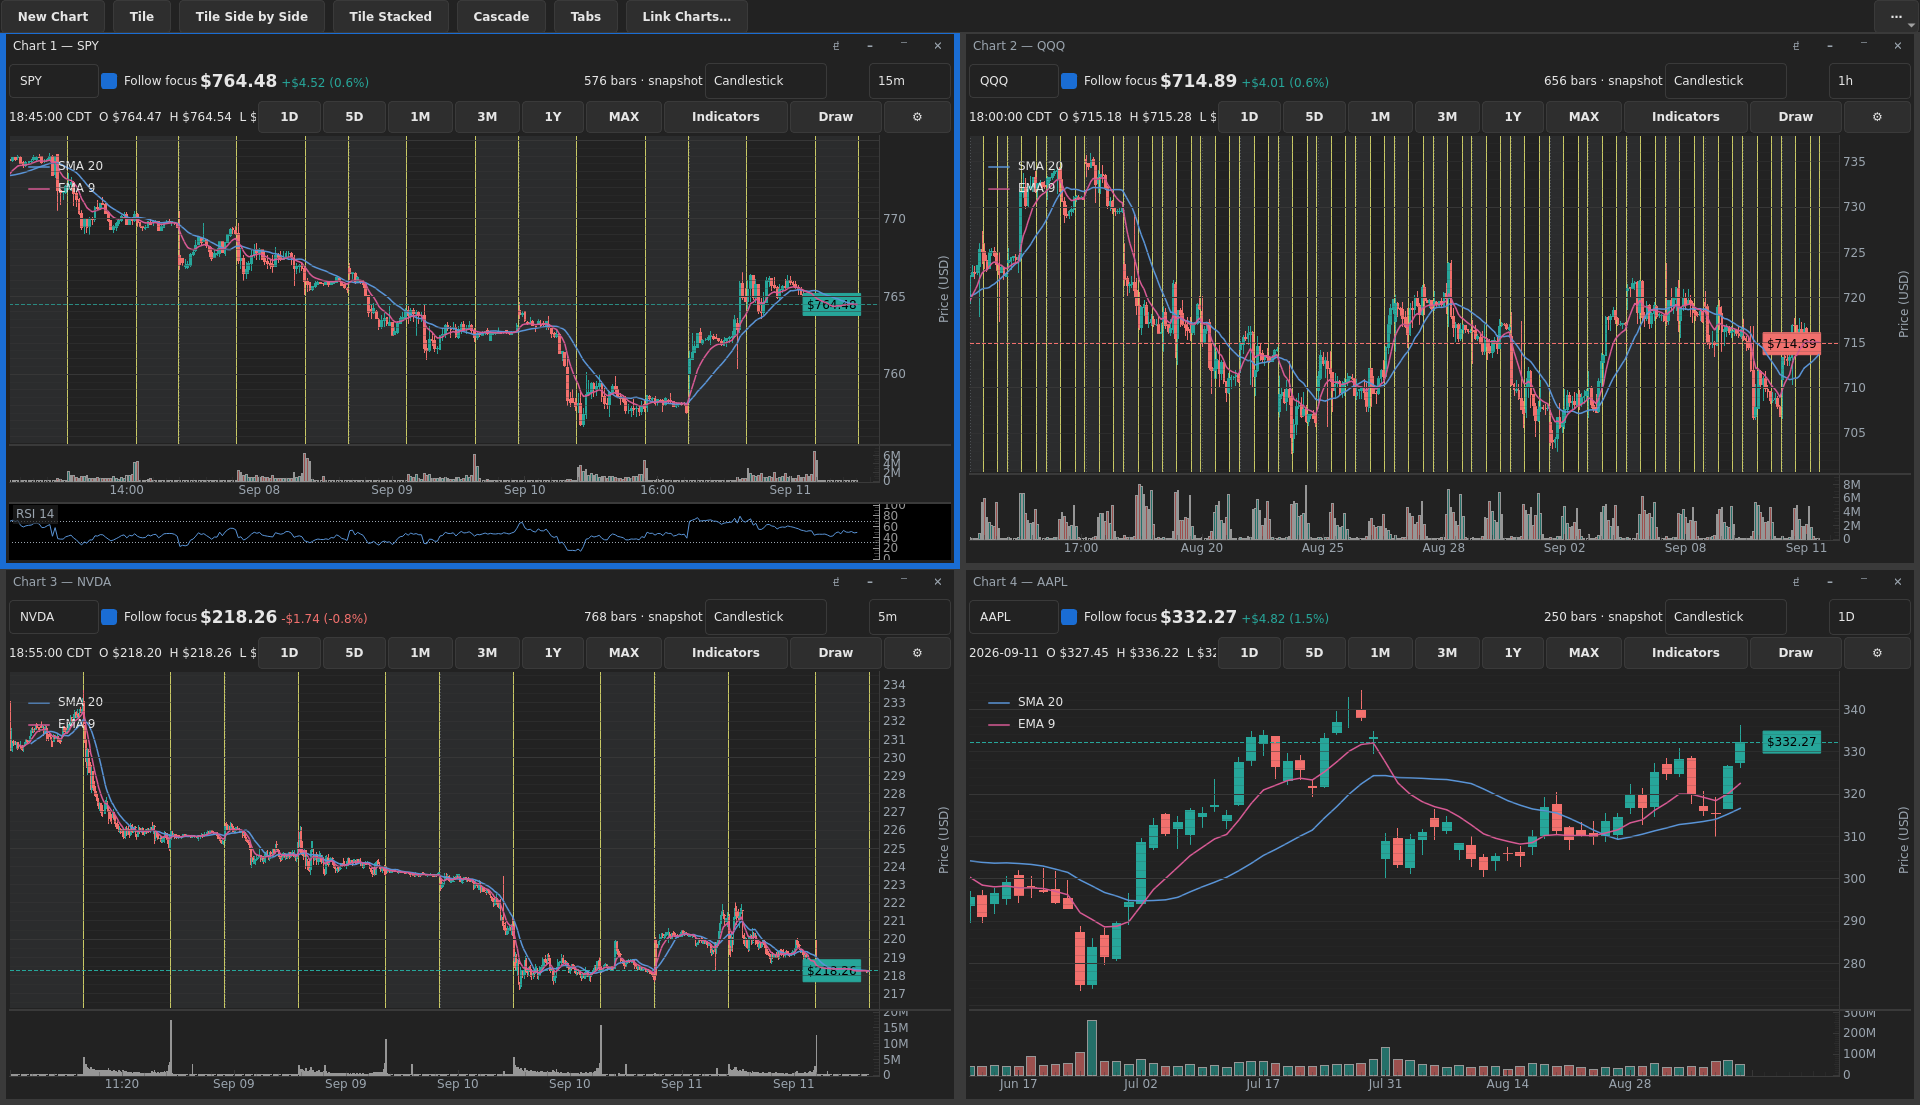
Eight charts across up to four canvases. Tile your views, keep independent timeframes and spread your workspace across monitors.

Desktop native chart canvas showing four real market charts for SPY, QQQ, NVDA and AAPL
Desktop · Native chart canvas · broker-provided SIP · September 13 captureView full size ↗

ONLINE / FROM A SIGNAL TO THE ACCOUNT RESULT

More than finding a trade.
Stay with the decision.

Keep your research, monitoring and portfolio review in the same workspace. The expanded Online tools are included alongside native Windows Desktop.

Make the alert useful.

Watch completed-bar setups, selected watchlists, order status, account risk and published research. Keep priority, acknowledgment, snooze and the source evidence together in a session-based alert desk.

Explore alerts ↗

Explain the portfolio result.

Compare funding-aware daily returns with ETF price benchmarks. Review contribution, sector and industry exposure, concentration and explicit dollar scenarios before opening a holding for closer review.

Explore portfolio analysis ↗

Put the desk where you need it.

Move Watchlist, Charts and Order ticket panels into docked positions. Drag symbols into your preferred order, save personal layouts and open linked chart, options and research windows.

Explore Total Pro ↗

SCRIPT STUDIO / ONLINE + WINDOWS DESKTOP

Your trading idea.
Your own tool.

Build an indicator, scan your watchlist, create an alert or define a stock strategy. Snap together visual blocks, edit the script, or work in Split view. One definition carries the logic from analysis to a historical test.

Explore Script Studio ↗
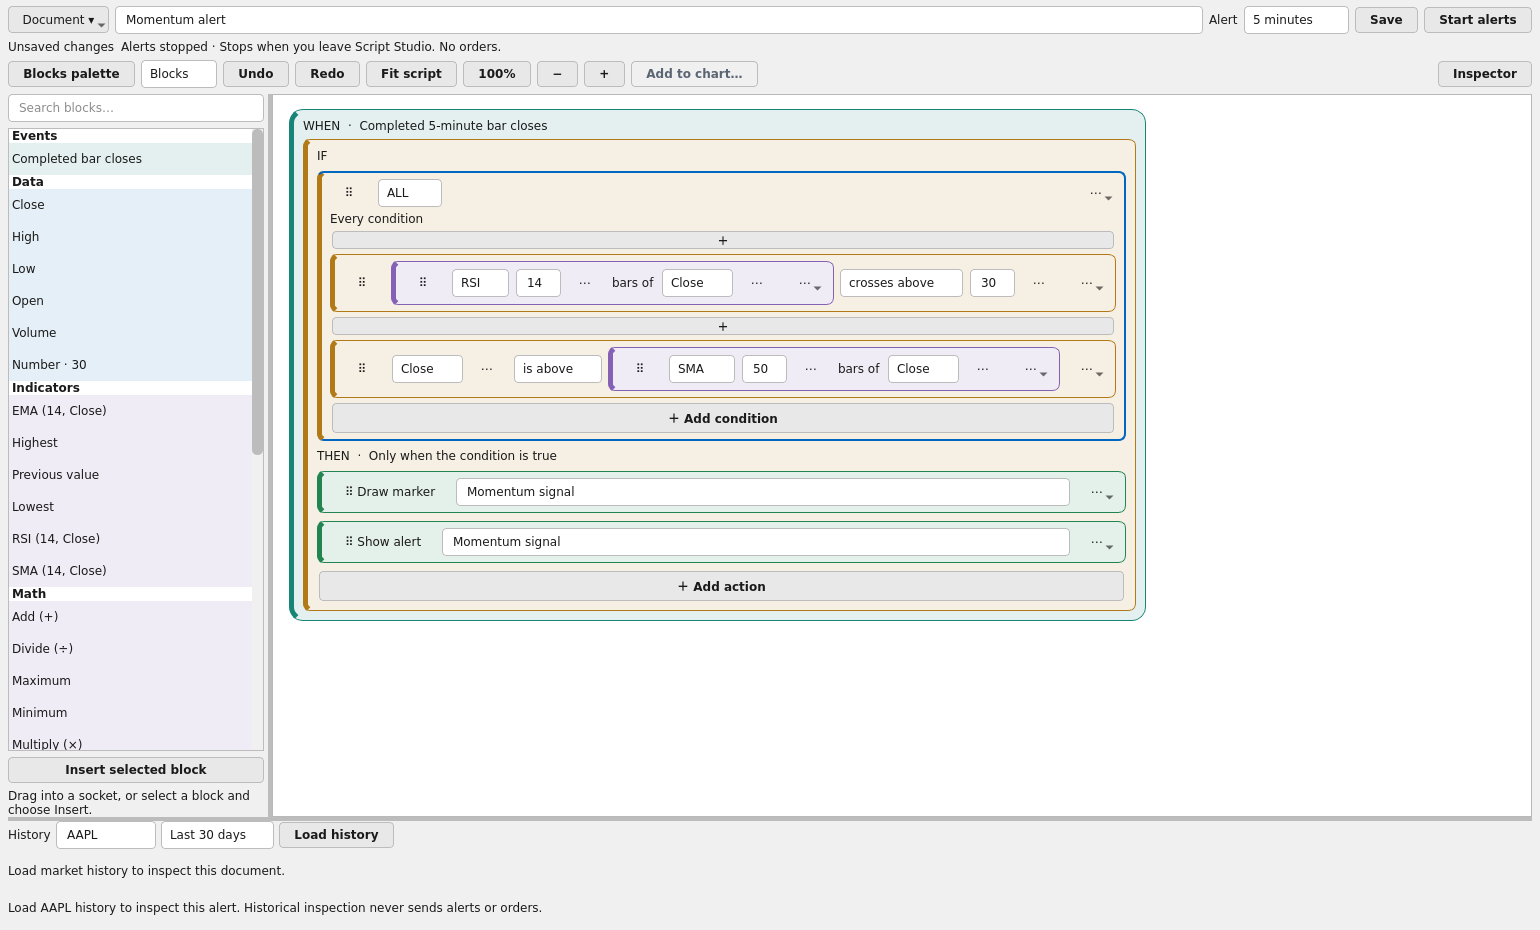
Native Desktop Script Studio blocks view showing the built-in RSI and moving-average momentum alert document
Desktop · Script Studio visual blocks · Light theme · September 28 · Editor only; no market history loadedView full size ↗

START WITH AN IDEA, NOT A BLANK PAGE

Make the rules yours.

Online includes 40 editable examples: 12 indicators, 12 scanners, eight alerts and eight stock backtests. Explore trends, momentum, breakouts, volume and price action, then save your own version.

  • See which conditions passed on a historical bar.
  • Turn useful conditions into reusable pieces.
  • Plot outputs and markers; inspect unavailable data.
  • Test strategy rules with explicit trading costs.

Shown: the actual native Desktop editor. The 40-example catalog is an Online feature. Script Studio does not submit unattended broker orders.

Build your first tool ↗

STOCK BACKTESTING / INCLUDED IN ONLINE + WINDOWS DESKTOP

Put your strategy
through its history.

A setup is an idea. A backtest lets you examine it. Build stock-trading rules, run a historical simulation and see the returns, drawdowns and individual trades behind the result—all in your shared subscription.

01 / DEFINE

Make the idea repeatable.

Start with a moving-average crossover, RSI pullback or MACD crossover. Set entry and exit rules, choose stocks and history, and define your starting capital and position sizing.

02 / COMPARE

Look beyond the return.

Include spread, slippage and commission assumptions. Compare the equity curve with buy-and-hold, inspect drawdown and follow the simulated trades that produced the result.

03 / CHALLENGE

Test how much the answer changes.

Reserve a later period for holdout testing. Compare nearby parameter choices, keep strategy versions and export results for a closer review.

20 shared cloud runs per UTC calendar month across Online and Desktop, subject to processing allowance. Long-only US common stocks · Daily or 15-minute history · Hypothetical results, not a forecast or live orders.

Explore stock backtesting ↗

ONE SUBSCRIPTION / ONLINE + DESKTOP

Both apps.
The whole toolkit.

30-day free trial, then $24.99/month for Online + Windows Desktop. Or $249/year paid upfront.

Intelligence Portal, Total Pro, stock backtesting, the 93-study library and Options Lab are included. Research the market, analyze a setup and review equity, options and multi-leg orders in the browser workspace or native Windows app.

YOUR BROKER CONNECTION

RockSolid is the workspace.
Your connected broker provides brokerage services.

Connect your own eligible paper or live brokerage account. Your funds, securities and market-data entitlements remain with your broker; account permissions and risk checks apply to trading.

The software subscription does not include a brokerage account or exchange-data entitlements.

brokerage connection help ↗

EXPLORE MORE OF ROCKSOLID

A full trading workflow, under one roof.

RockSolid brings research, technical analysis, options and account review into one subscription for Online and Windows Desktop.

See the apps at work.

Short, narrated lessons with captions and written steps. Choose the app you use.

Important Disclosures

RockSolid Trader is software. Rock River Research, LLC is not a broker-dealer, not an investment adviser, and not a member of FINRA or SIPC. We do not provide investment, tax, or legal advice, and nothing in this application or on this site is a recommendation to buy or sell any security. Brokerage services, market data, order execution, and custody of funds are provided by your own brokerage account under your separate broker agreement, under your agreement with them. Availability is subject to your broker eligibility and local regulations. Trading involves risk, including the possible loss of principal. Market data may be delayed, incomplete, or unavailable, and software may fail; you are responsible for verifying your own orders and positions with your broker. RockSolid Trader is not affiliated with, endorsed by, or sponsored by your brokerage provider.